Mobile Game Monetization: Impossible Date 2's ROI Model
Estimating Impossible Date 2's ad revenue, LTV and 24-day payback: a mobile game monetization model for Google Play in the US.
In this article7 sections
This week’s hyper-casual case study in mobile game monetization is Impossible Date 2: Fun Riddle, the sequel to Impossible Date. The two play much the same. The sequel’s level design and UX interactions are just a bit more straightforward.
The goal here is a model estimate, so one platform is enough, and this article covers Google Play data for the US only. The game has almost no meta system and its IAP isn’t good value, so we judge IAP to be a very small share of revenue. The revenue figures below therefore cover ad monetization only and leave IAP out.
Gameplay
It’s a puzzle game. Each level gives the player a scene and a problem, and the player has to act to solve it. Here is a screenshot of Level 1:
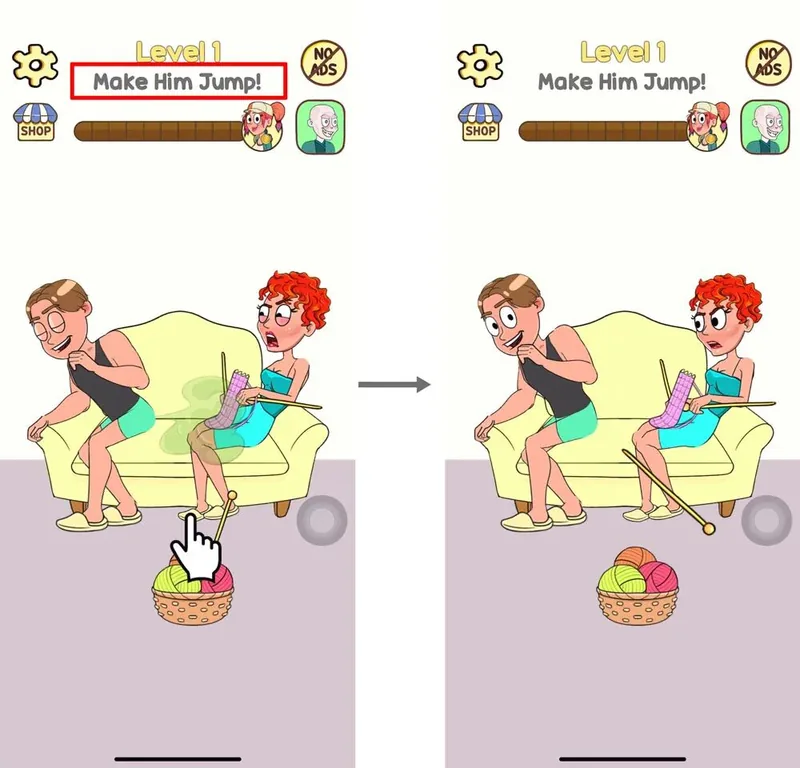
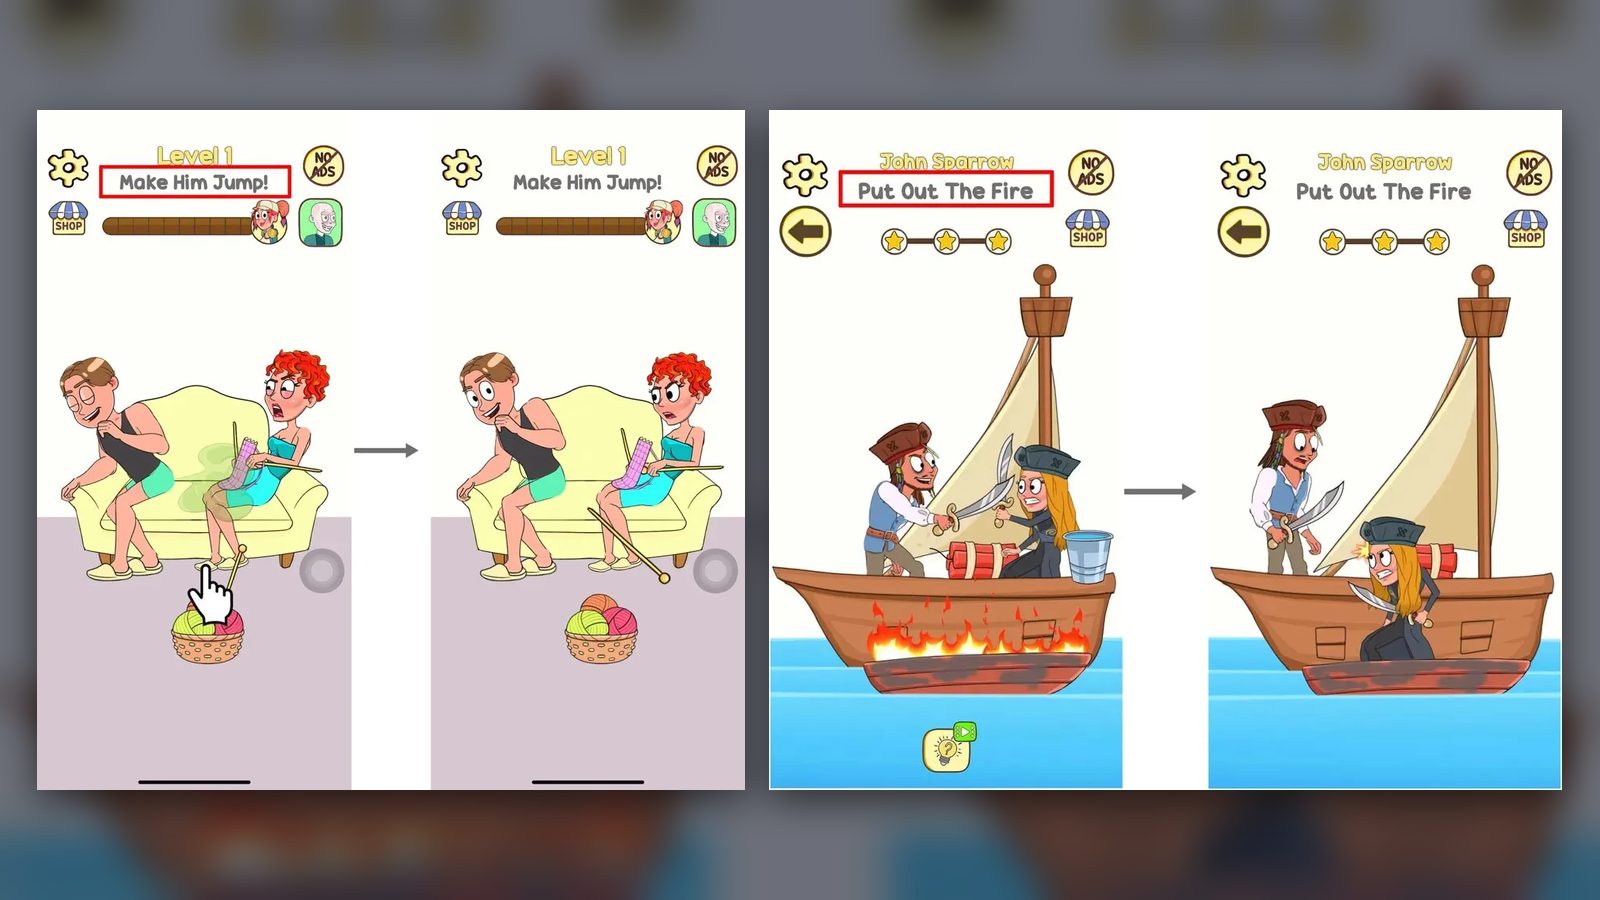
A man is farting nonstop at a woman, and the player has to find a way to stop him by making him jump. The solution: the player moves a needle and pokes him, he jumps, and that clears the level. It’s a variant of the save-the-dog puzzle.
Special levels also blend in some American IP, such as Pirates of the Caribbean:
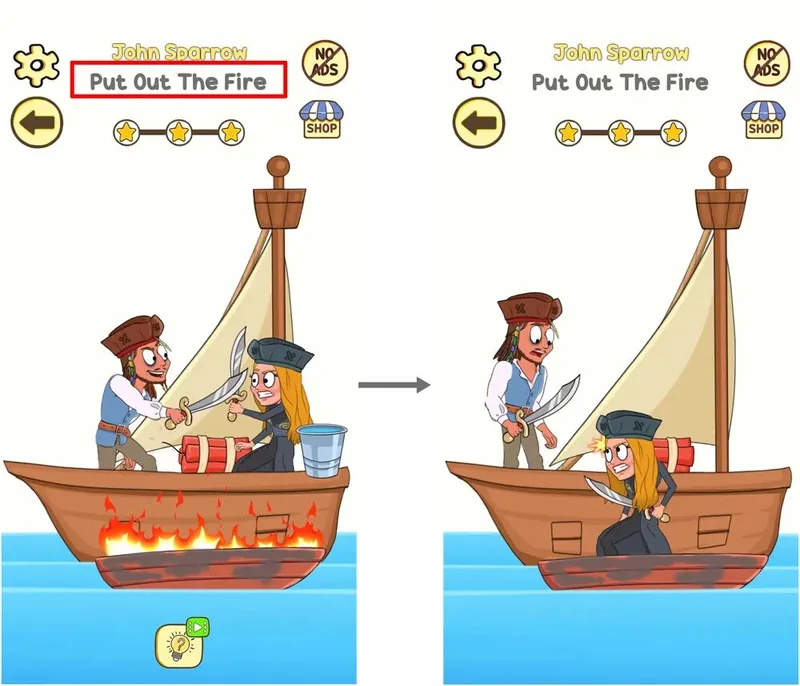
Every few levels a hidden-object level turns up. Overall, the average level takes 20–30 seconds.
Estimated retention
Estimated retention, based on benchmarks for hyper-casual games and adjusted for this one:
| Day | Retention |
|---|---|
| D1 | 45% |
| D7 | 15% |
| D14 | 7% |
| D30 | 2% |
These are the retention rates for the key days. The retention estimate is mainly used to calculate LT (lifetime).
As an example, start with the game’s 30-day LT:
Retention for the days in between is derived from a power function.
Ad monetization and user acquisition baselines
Baseline monetization and UA figures (US):
| Metric | Value | Notes |
|---|---|---|
| Interstitial eCPM | $10 | Recent industry average |
| Rewarded eCPM | $13 | Recent industry average |
| Banner eCPM | $0.3 | Recent industry average |
| CPI (paid UA only) | $0.4 | Upper end of acceptable hyper-casual CPI |
Estimated ad behavior
Ad behavior estimates (US):
| Metric | Value | Notes |
|---|---|---|
| Daily playtime (minutes) | 25 | Estimate from the 20-minute hyper-casual benchmark, adjusted for this game |
| Interstitial impressions per user per day | 5 | From playing the game |
| Rewarded impressions per user per day | 4 | From playing the game |
| Banner impressions per user per day | 50 | Refreshes every 30 seconds: 2 a minute over 25 minutes makes 50 |
| ARPU | $0.117 | Calculated from the figures above:; ARPU=(5*$10+4*$13+50*$0.3)/1000 |
LTV calculation
Putting the figures above into the formula gives the game’s LTV:
LTV = LT * ARPU
With the 30-day LT already worked out, the game’s
30-day LTV = 3.61*$0.117 = $0.422
The 30-day LTV is already above the paid-UA CPI of $0.4, so the game pays back within 30 days.
Revenue and payback period estimate
Here is the precise calculation, with all the numbers summarized (US):
| Metric | Figure |
|---|---|
| DAU | 100,000 |
| ARPU | $0.117 |
| Daily revenue | $11700 |
| Payback period (paid UA only) | 24 days |
That is our payback model built on paid UA alone. When a game is actually published, it also gets some organic installs, and organic volume grows as daily new installs scale up. The organic share depends on how well each game’s ASO is done, but in general it is at least 10%.
At the time of writing, the game was No. 8 on the Google Play US overall free chart. As its chart rank climbs, the organic share keeps rising. At its best, organic volume can reach 200%, and the payback model looks very good. But once installs reach a certain scale, paid CPI keeps climbing while monetization can’t go any higher, so the game goes into decline.
That wraps up the paid-UA payback model for Impossible Date 2: Fun Riddle. Some of the data comes from third parties, and some from hands-on play and estimates. If you have a better approach or see a problem in the logic, corrections are welcome.